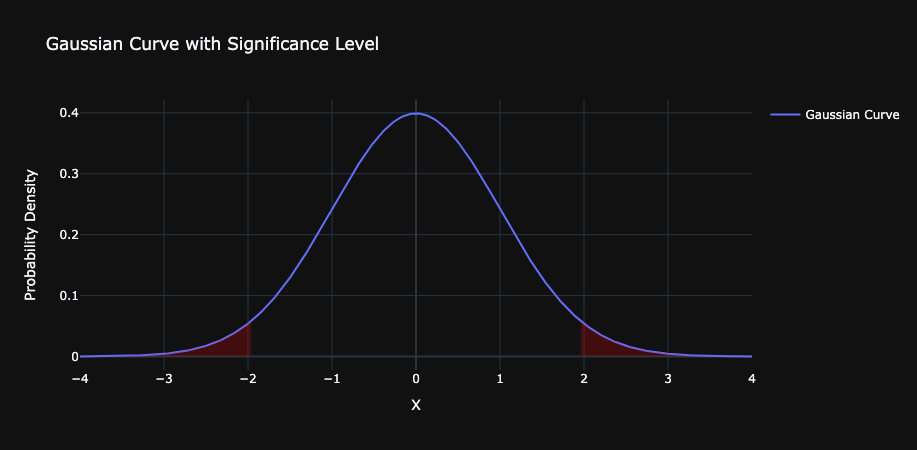
The Gauss Curve, also known as the Gaussian distribution or Normal distribution, is a fundamental concept in statistics, representing the distribution of values, scores, or measurements that cluster around the mean in a symmetrical, bell-shaped pattern. This distribution is described by two parameters: the mean (\(\mu\)) and the standard deviation (\(\sigma\)).
The mathematical formula for the Gauss Curve is given by the probability density function (PDF):
\[ f(x) = \frac{1}{\sigma\sqrt{2\pi}} e^{-\frac{1}{2}\left(\frac{x-\mu}{\sigma}\right)^2} \]
Where:
- \(x\) represents the variable of interest,
- \(\mu\) is the mean of the distribution,
- \(\sigma\) is the standard deviation, and
- \(e\) is the base of the natural logarithm, approximately equal to 2.71828.

The Gaussian distribution is significant for several reasons:
- Central Limit Theorem: It states that the sum of many independent and identically distributed random variables, regardless of their original distribution, will tend to follow a Gaussian distribution as the sample size increases.
- Ubiquity in Natural Phenomena: Many natural and social phenomena follow a Gaussian distribution, such as heights, test scores, and measurement errors.
- Statistical Inference: The normal distribution is foundational in hypothesis testing, confidence intervals, and other statistical inference techniques.
Characteristics of the Gauss Curve include:
- Symmetry about the mean,
- The mean, median, and mode of the distribution are equal,
- The area under the curve corresponds to the probability of occurrence, totaling 1,
- Approximately 68% of the data falls within one standard deviation of the mean, 95% within two standard deviations, and 99.7% within three standard deviations (the 68-95-99.7 rule).
Understanding the Gaussian distribution is crucial for analyzing and interpreting data, supporting decision-making in fields like economics, engineering, psychology, and biology.
For more visit 3b1b
